


Court Data
November 2025: Pendency steadily increases by 400 cases
In November 2025, the Court pendency inched closer to 91000, as institutions soared and disposals failed to keep up

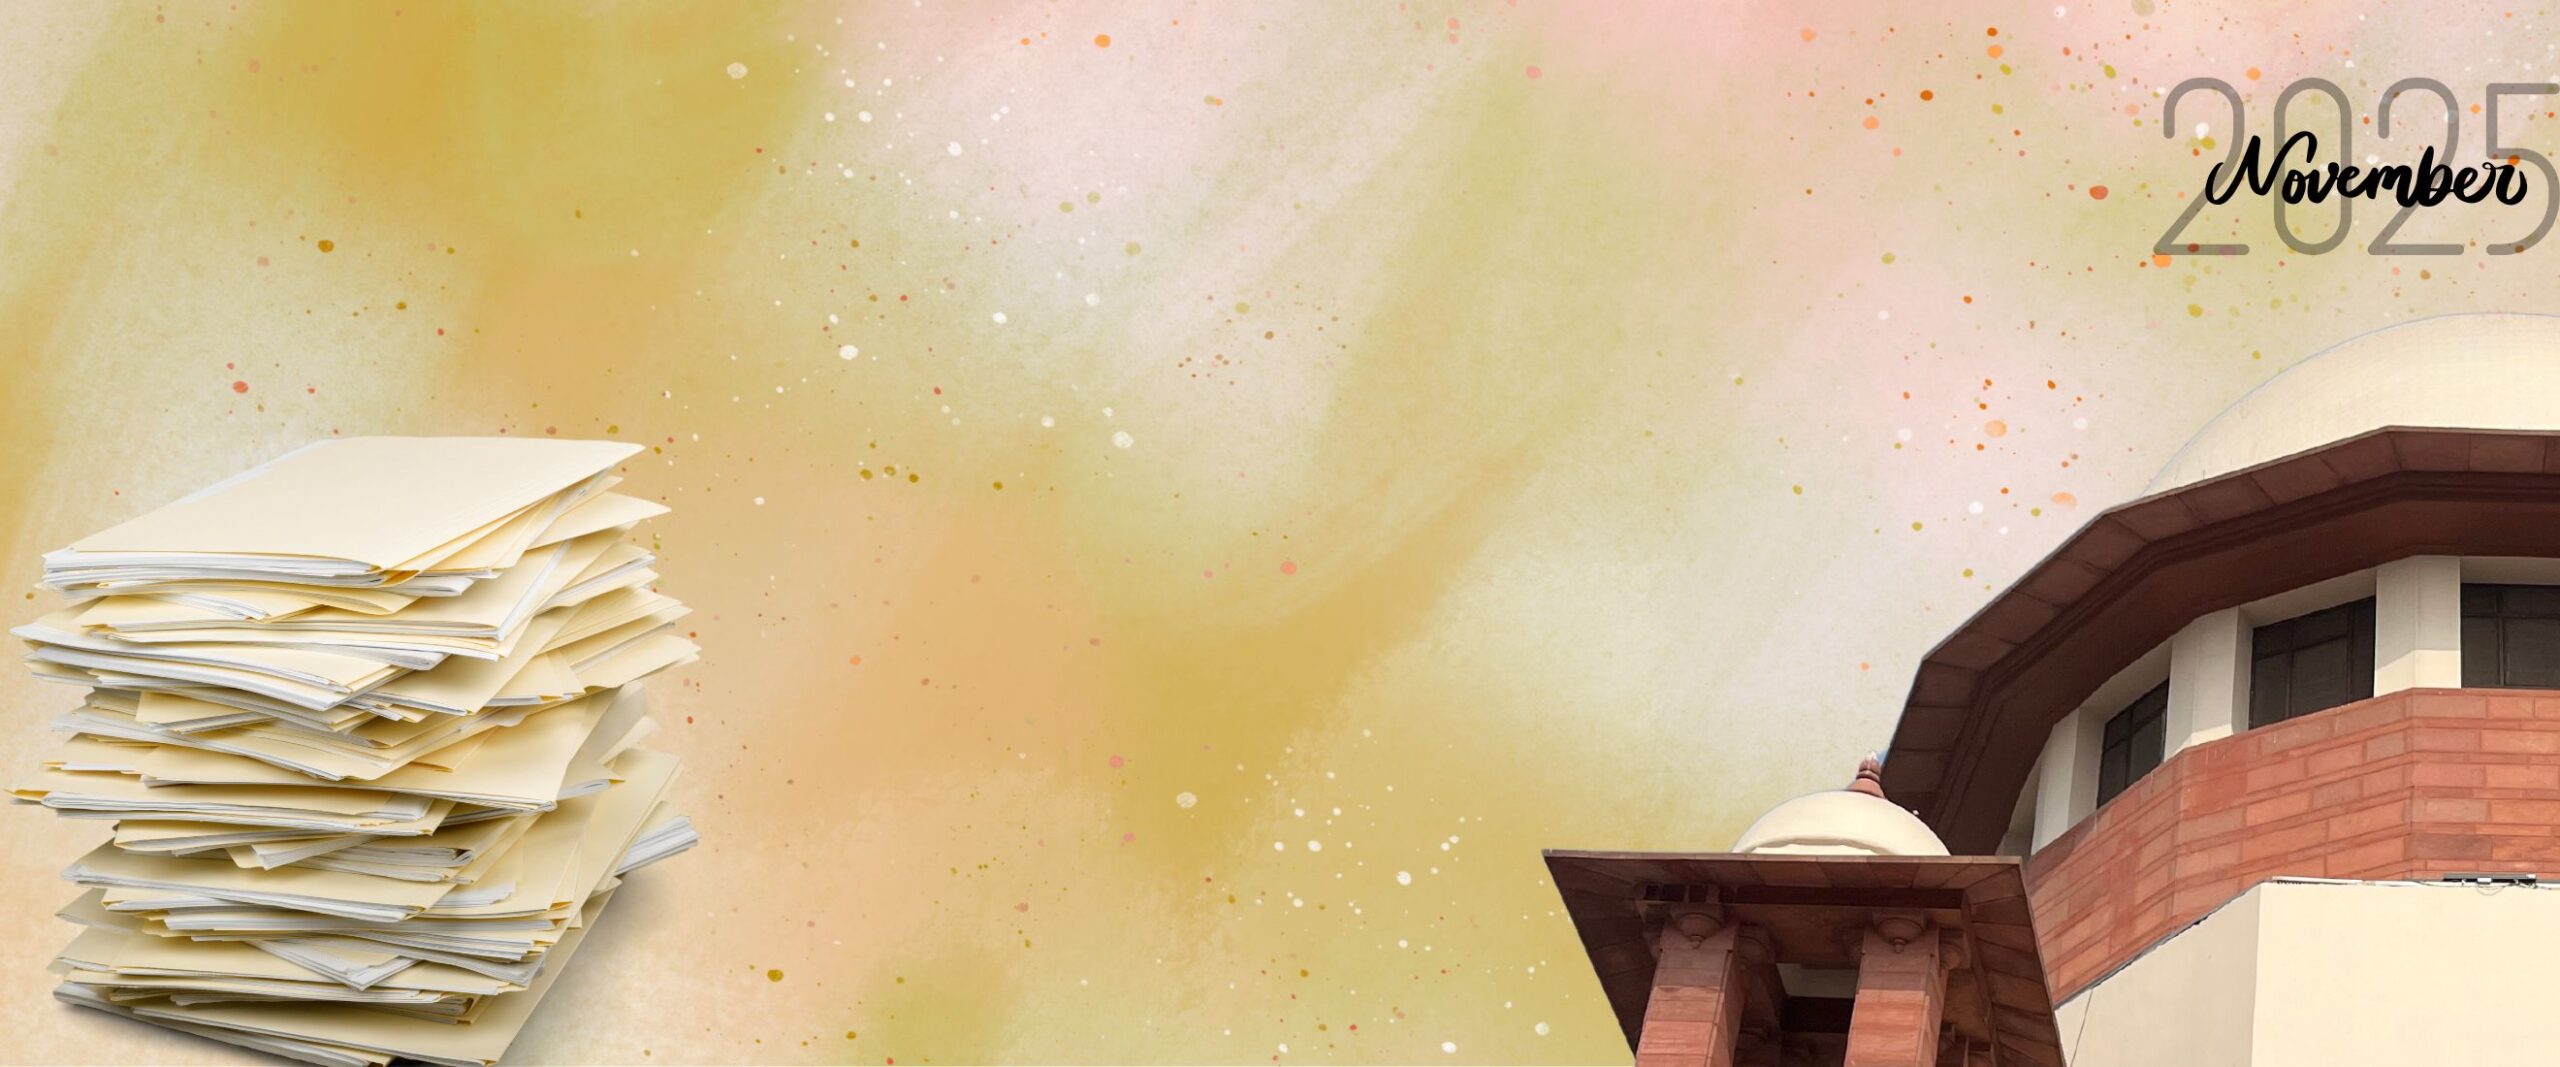
The Supreme Court’s case backlog grew by 444 cases in November 2025, reaching a total of 90,694 pending matters. This trend is in line with our previous assessment that the Court is facing a looming pendency crisis.
Figure 1 plots the pendency numbers at the end of each month. The year began with 82,445 cases in January. This number saw a substantial decrease of 1463 cases in February. Pendency showed no sharp increase or decrease in March (increase by 412 cases), April (increase by 407 cases), and May (reduced by 67 cases).
Interestingly, pendency substantially increased by 3470 cases in June. This is not out of the ordinary as case pendency tends to increase in June, a month when the Court takes a partial break. Fewer benches hear cases during this period. We often see a drop in the figures in July when the Court resumes its full functions—a pattern visible in 2023 and 2024.
However, this did not happen in 2025, and pendency continued to increase in July, August, September and October, with each month setting a new high. Effectively, the Supreme Court saw a net increase of 8,249 cases between January and November.
Pendency over five years
Figure 2 plots the total number of pending cases in November of each year since 2020. The data shows a steady increase since 2020. While the pandemic years saw a spike, November 2022 marked a brief respite with a net fall of 257 cases.
The rise between 2022 and 2023 is largely explained by a change in counting methodology: the Court began including all diarised matters—including Miscellaneous Applications, Unregistered Matters, and Defective matters—in the official pendency count.
Pendency increased by over 2000 cases between November 2023 and 2024. This jumped to 90,694 cases by November 2025—a net increase by 8347 cases in 12 months. In our analysis of pendency in the CJI Gavai Court, we wrote about how the steep increase could be due to a lack of focused strategy. This was a marked difference in comparison to his predecessors who had developed unique approaches to tackle the backlog.
Constitution Bench pendency
Figure 3 shows two donut charts tracking pendency in main and tagged Constitution Bench matters. Main matters are lead petitions in which the Court has identified a substantial question of law. Tagged matters are cases whose disposal depends on the outcome of the main matter.
The data indicates that there has been no change in total Constitution Bench pendency compared to the previous month. This is notable considering that the Court concluded two Constitution Bench matters. It delivered a judgement on reservations for civil judges and an advisory opinion in the Presidential Reference concerning powers of Governors and the President.
There were no seven- or nine-judge bench decisions this year. This situation is expected to change, however, as Chief Justice Surya Kant has expressed interest in resuming larger bench sittings from January 2026.
Figure 4 compares how cases have been instituted and disposed of in 2025. Institutions are the number of cases filed in the Supreme Court and disposals are the number of cases that the Court has decided, dismissed or disposed of. If institutions are more than disposals, pendency will increase and vice versa.
Disposals outpaced institutions in January and February but this did not continue for the rest of the year. In our pendency report card of CJI Gavai we found that there were more than 7000 institutions in May, July, August and September. This is extraordinary considering that institutions have generally remained between 3000-6000 in the past. Institutions dropped in October (5873) but increased in November (6322).
Note: For our pendency, institution and disposal articles, we primarily rely on the data provided on the National Judicial Data Grid (NJDG). We cross-check institution and disposal numbers with the Justice Clock. Typically, on the fifth of each month, the institution and disposal numbers on both portals match, but this time, the Justice Clock showed 7 more disposals than the NJDG.
Related articles

Court Data
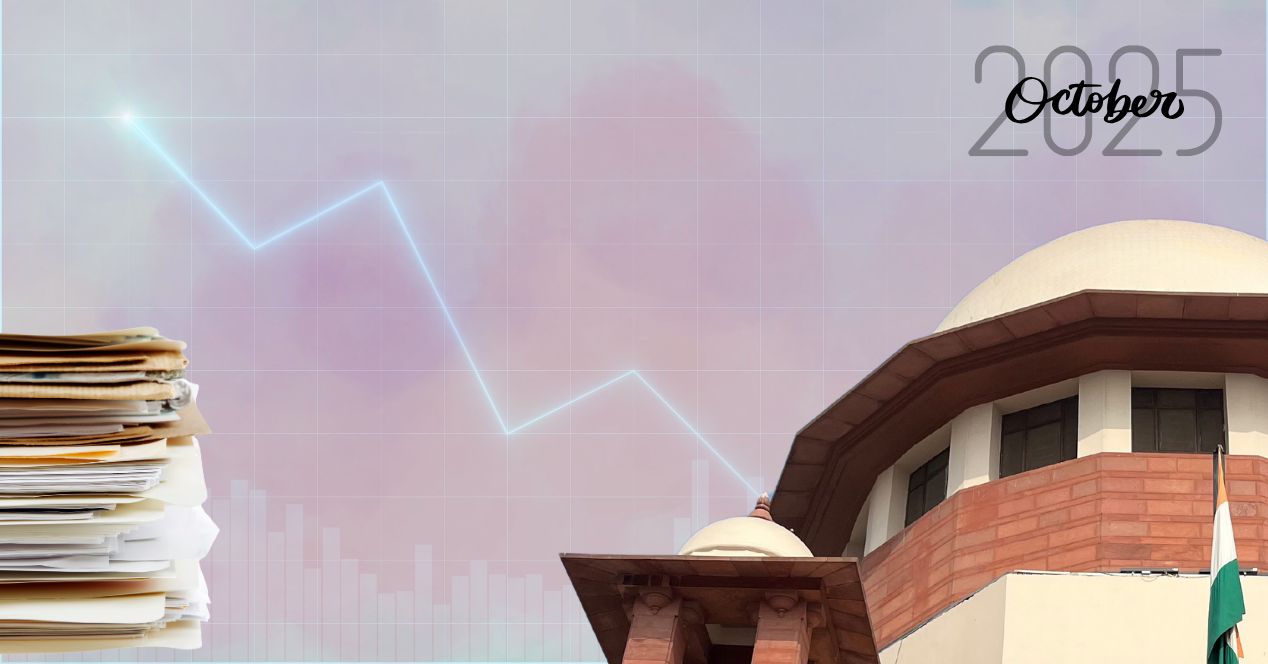
October 2025: Is the Supreme Court approaching a pendency crisis?
In October 2025, the Court breached the 90,000 mark; the highest it has seen in recent years
Court Data
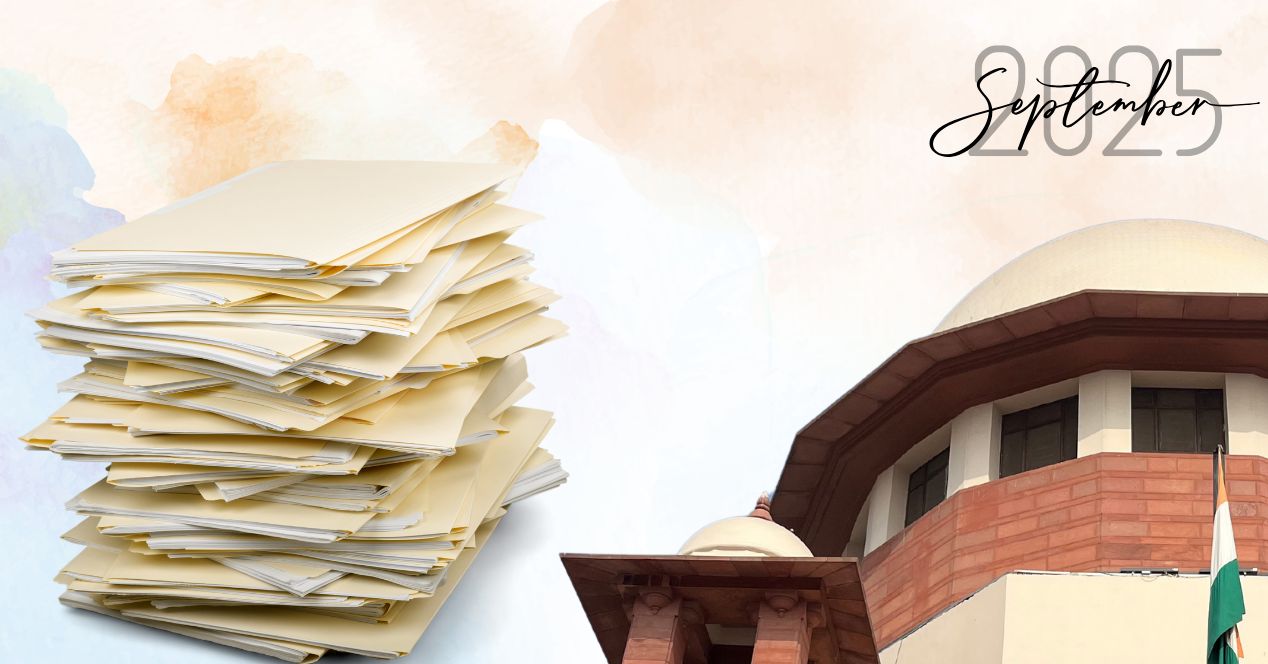
September 2025: Pendency nears 89,000 mark
With 7,234 new cases filed and 5,596 disposed of, pendency rose to 88,625 in September 2025, the highest this year
Court Data
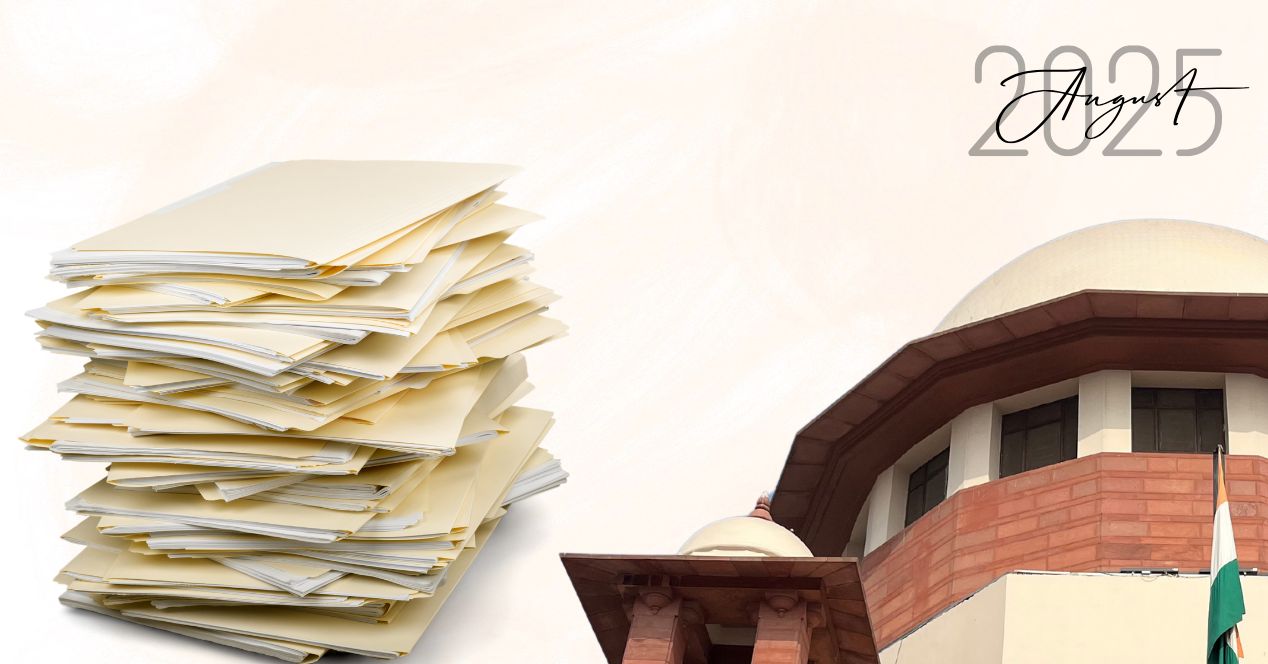
August 2025: Pendency crosses the 88,000 mark
With over 7000 new cases instituted, the trend of increasing case pendency at the Supreme Court continued in August 2025
Court Data
July 2025: Pendency soars to a staggering 87,000 cases
The number of cases instituted increased, the disposal rate dropped and the pendency increased by 1900 cases since June