
Court Data
Low number of summer vacation judgments
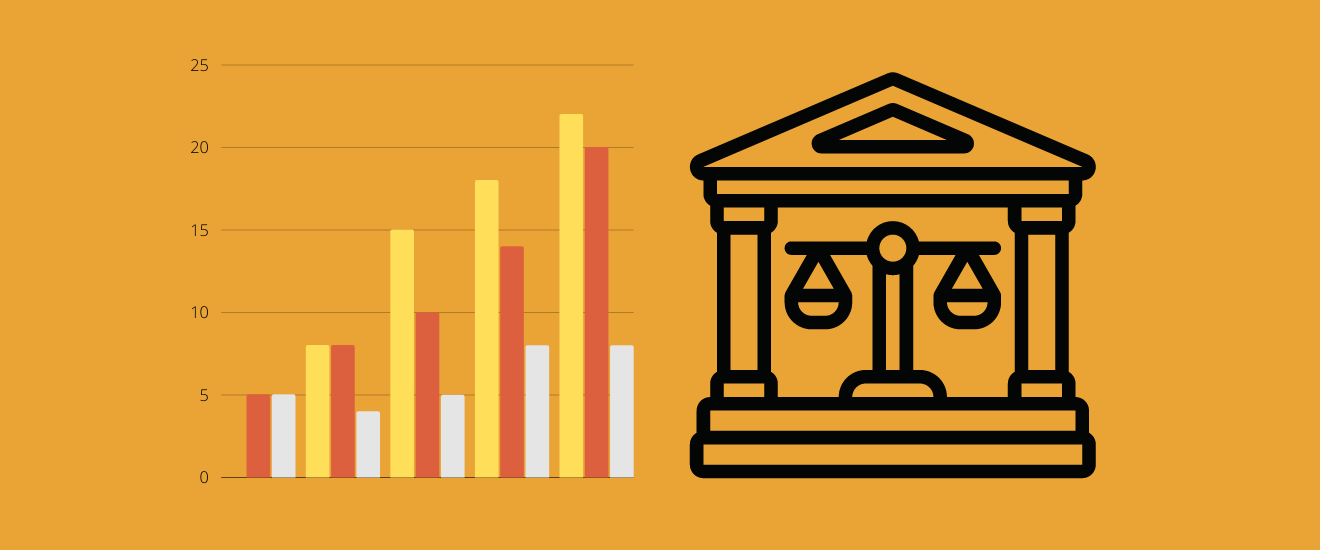
Variation in the yearly number of judgments delivered during the summer vacation of the Supreme Court.
update: as of 21.06, the Court has now produced 3 judgments.
*see italicized below
During the month of June, the Supreme Court of India is on summer vacation. The Court is only partially functioning and produces a much reduced number of judgments. How much reduced?
This year, as of June 18th 2019, the Supreme Court has only produced 1 reported judgment, according to its official website. The Court reopens on July 1st. By contrast, in 2016 it produced 47 judgments. Evidently there has been a large variation in the number of judgments delivered during the summer vacation, in the last ten years.
Given that the total number of judgments produced in a year varies, it is is worth considering whether the variation in summer vacation judgments is tied to the total variation. If it were we would expect to see that the proportion of summer vacation judgments stays constant to the total number of judgments. This is not the case – for example, in 2012 the proportion is 0.2%, whereas in 2016 it is 3.9%. There appear to be factors contributing to the number of summer vacation judgments delivered that are independent of those that determine the number of total judgment delivered. However, it may also simply be due to random variation (the sample size of summer vacation judgments is very small). Given how few judgments are delivered, there may be more to be ascertained by studying regular hearing disposal during summers instead.
data source: Supreme Court of India website; SCC Online
*It should be noted that there were discrepancies in the data reported on the Supreme Court of India’s (SCI) website. For example, for June 2017 the website reports a total of 97 judgments, however, 91 of these are repetitions of the same judgment. In order to control for these discrepancies, we also counted the number of judgments reported on SCC. The numbers on SCC and SCI do not match. However, for the most part they follow the same trends. In the above graph, we have averaged the SCC and SCI numbers per month. Hence, the graph should not be taken as accurate representation of the number of judgments delivered, but rather a general indicator of the large variation in summer judgments delivered.